Analyzing SPCS application telemetry with Snowflake Trail
12 May 2025
Observability is a key requirement we hear about a lot from Snowpark Container Services (SPCS) customers, whether they are developing and debugging their containerized workload, or when they are monitoring it in production or troubleshooting an outage. Let’s walk through an example of how to use some awesome new Snowflake Trail observability capabilities with SPCS.
There are multiple types of telemetry that can be useful when working with containerized applications:
- Application logs - logs emitted by your application code
- Application metrics - quantitative metrics assessing the performance of the user’s code. This complements SPCS Platform metrics, which provide CPU/GPU/Memory usage, network/storage throughput, and other metrics about the infrastructure that hosts your containers
- Application traces - provide a detailed record of how requests flow through your application, helping you identify performance bottlenecks, understand dependencies between services, and troubleshoot complex issues that logs alone might not reveal.
Snowflake makes it easy to collect and durably store all this telemetry within a single central observability solution called Snowflake Trail, and you can find a great overview here. There are two main Trail capabilities that we’ll refer to:
- Event Tables - dedicated account-level tables where SPCS sends all collected telemetry
- Traces & Logs tab in Snowsight - a convenient UI for exploring traces and logs stored in Event Tables
In this post, we’ll use a stock API example hosted in SPCS, which offers the stock price, top gainers, and lets you look up the exchange where an individual stock is traded. Check out this video, or keep reading for more detail on how the app was instrumented:
Application logs
By default, SPCS collects any logs sent by your application to stdout and stderr. For example, in Python you may set up logging like so:
import logging

# Set up logger
logger = logging.getLogger("stock_snap_py")
logger.setLevel(logging.INFO)
ch = logging.StreamHandler()
ch.setFormatter(logging.Formatter("%(asctime)s;%(levelname)s:  %(message)s", "%Y-%m-%d %H:%M:%S"))
logger.addHandler(ch)

# Emit log line
logger.info(f"GET /stock-price - 400 - Invalid symbol")
Logs can be retrieved using the SYSTEM$GET_SERVICE_LOGS function in SQL. Snowflake Trail offers a handy visual view of the same log data, with the ability to sort and filter by time period, as well as search the logs.
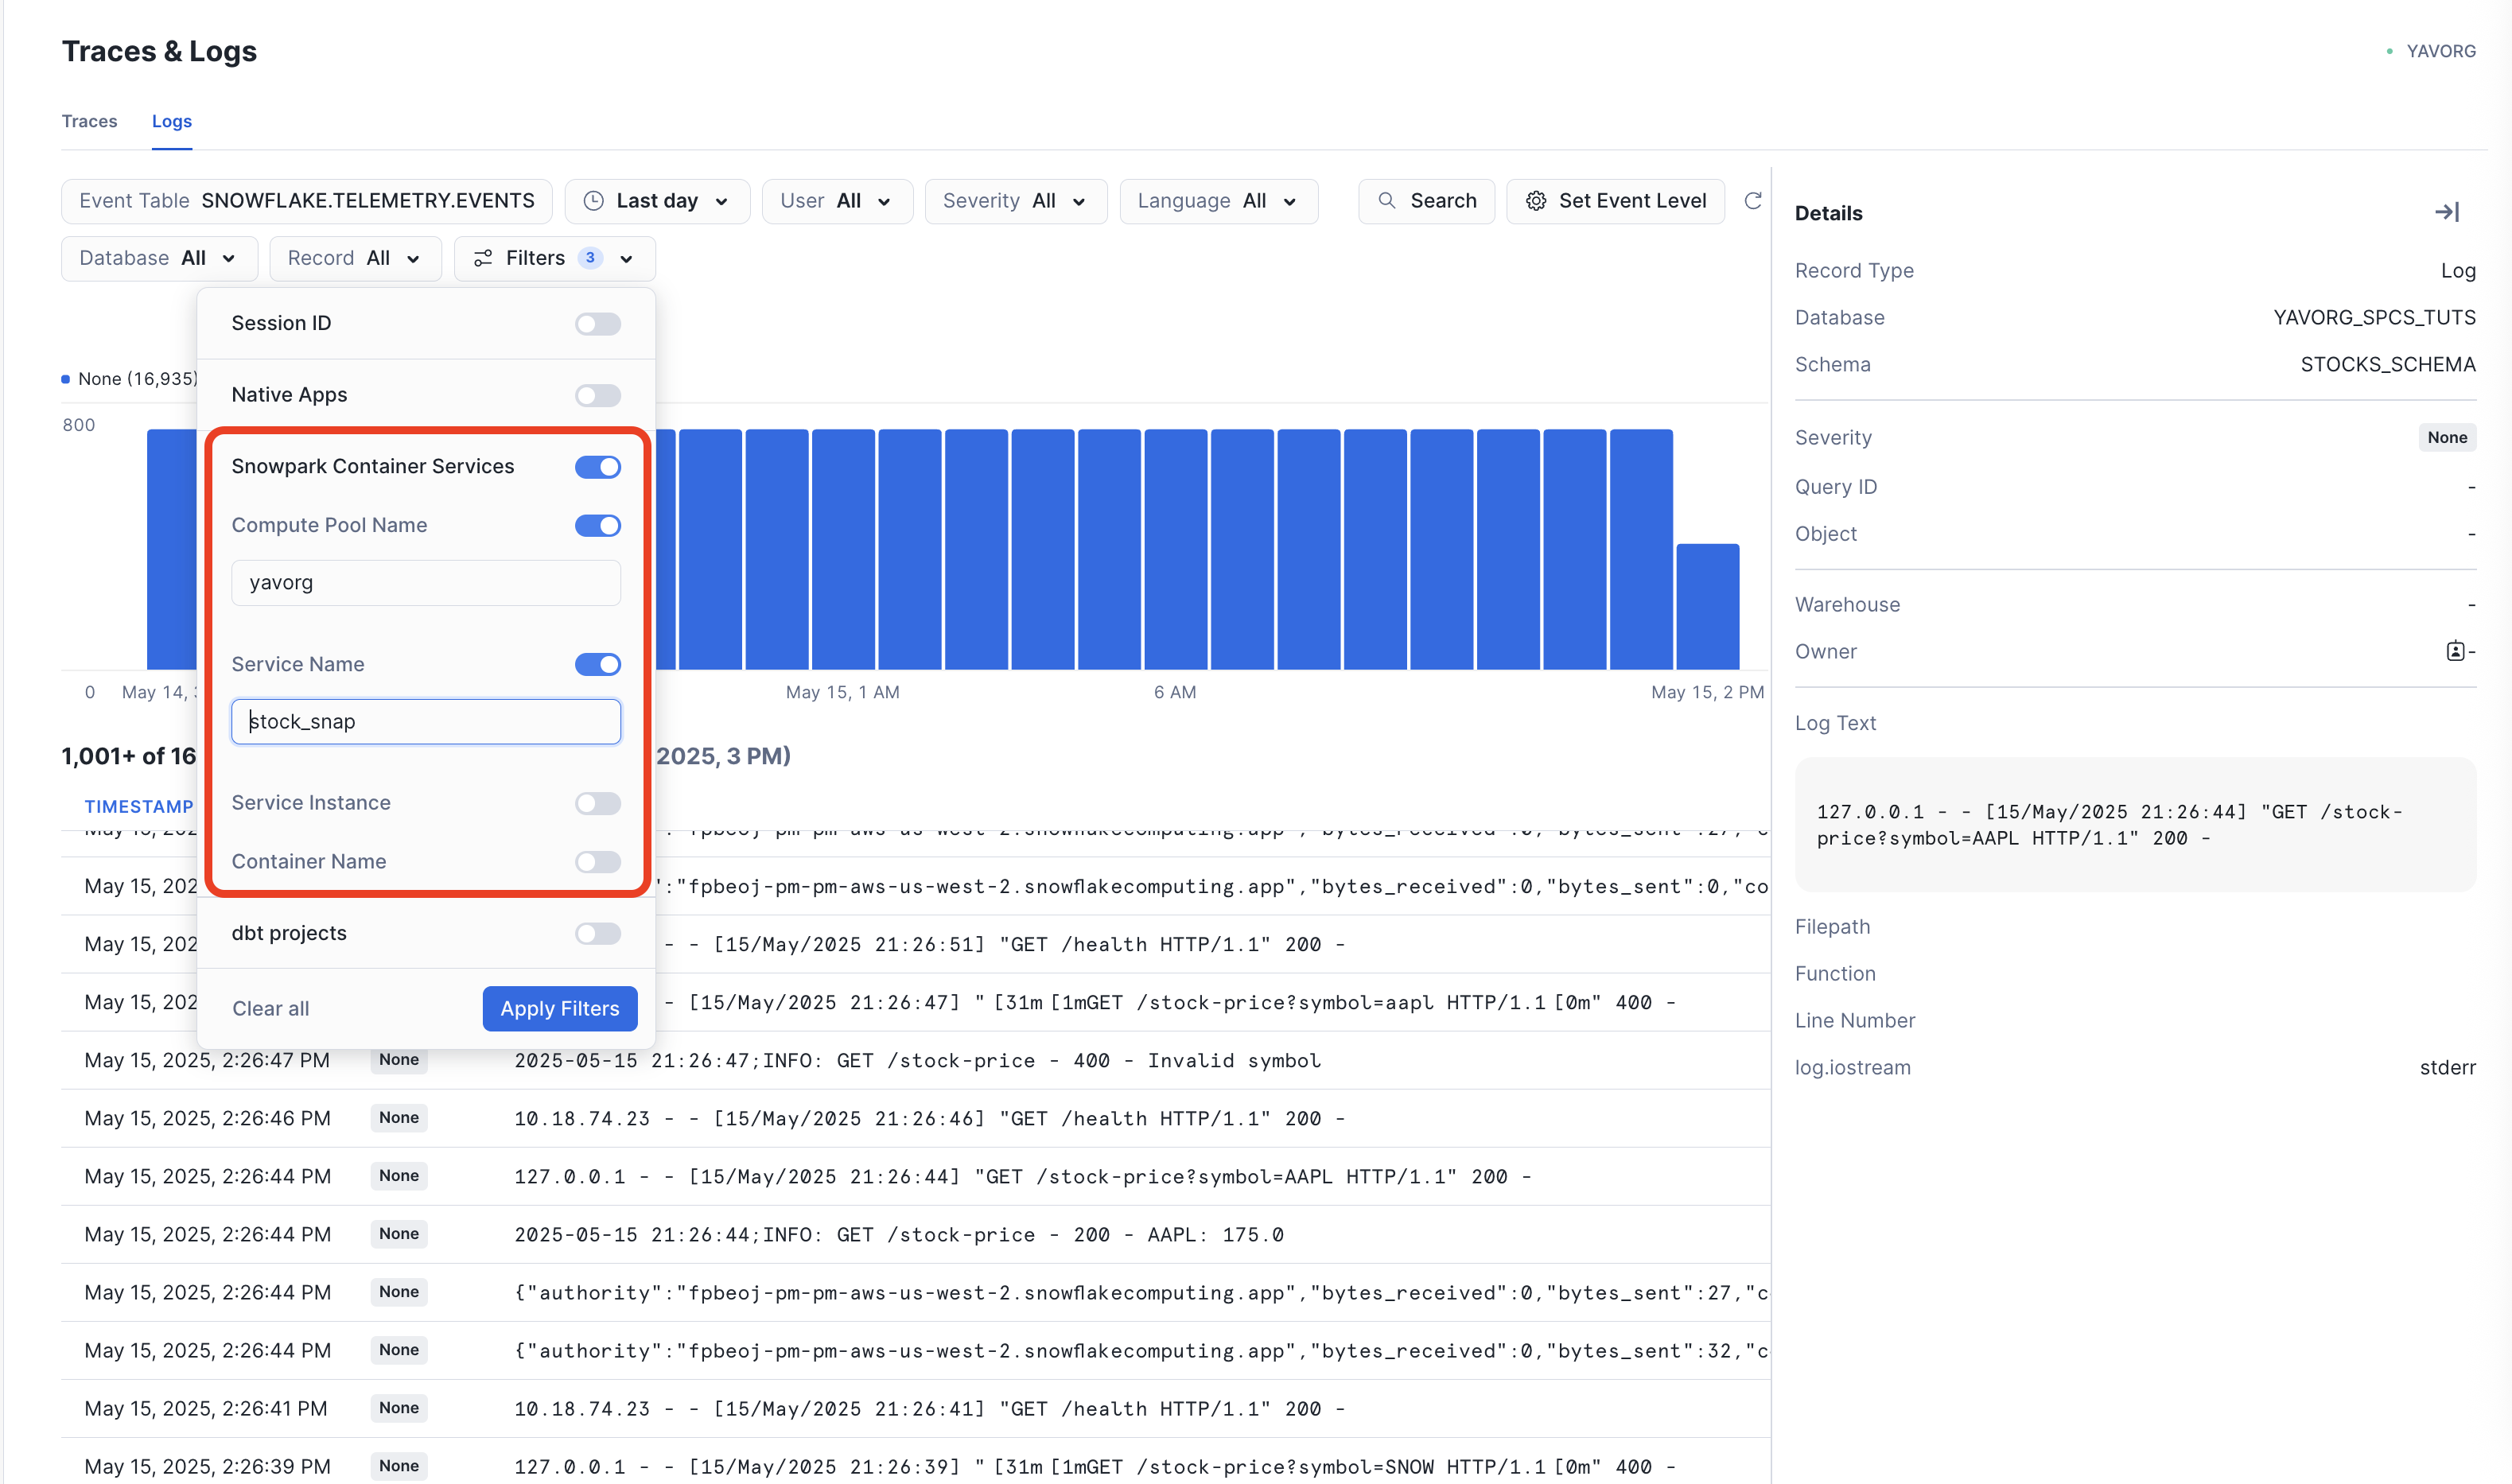
To use the Trail logs viewer, ensure your account-level Event Table is selected in the Event Table filter, and you have selected the correct Compute Pool and Service Name in the Filters drop-down.
For more information on application logs, check out our documentation.
Application metrics
At a high-level, customers frequently want to get a quantitative view of how their containerized workload is doing, either for troubleshooting performance issues, or for getting an idea of utilization.
SPCS supports automatic collection of OpenTelemetry metrics, as long as your application is instrumented to emit them. Instrumentation is generally pretty straightforward, using standard OTLP clients. SPCS will emit the necessary environment variables that the clients use to know where to publish telemetry. Check out this Python example:
from opentelemetry.exporter.otlp.proto.grpc.metric_exporter import OTLPMetricExporter
from opentelemetry.sdk.metrics import MeterProvider
from opentelemetry.sdk.metrics._internal.export import PeriodicExportingMetricReader
from opentelemetry.sdk.resources import Resource
from opentelemetry.metrics import set_meter_provider, get_meter_provider

# OpenTelemetry setup for metrics
metric_exporter = OTLPMetricExporter(insecure=True)
metric_reader = PeriodicExportingMetricReader(exporter=metric_exporter, export_interval_millis=5000)
meter_provider = MeterProvider(metric_readers=[metric_reader], resource=Resource.create({"service.name": SERVICE_NAME}))
set_meter_provider(meter_provider)
meter = get_meter_provider().get_meter(SERVICE_NAME)

# Set up custom metrics
request_counter = meter.create_counter(
    name="request_count",
    description="Counts the number of requests"
)
response_histogram = meter.create_histogram(
    name="response_latency",
    description="Response latency",
    unit="ms"
)

# Capture application metrics
start_time = time.time()
# Do work
response_time = (time.time() - start_time) * 1000

request_counter.add(1, {"endpoint": STOCK_PRICE_ENDPOINT})
response_histogram.record(response_time, {"endpoint": STOCK_PRICE_ENDPOINT})
In certain cases, customers favor Prometheus-style metrics instrumentation, where metrics are being collected from the container, versus being published. To support this scenario, SPCS supports a Prometheus sidecar collector to pull these metrics and store them in the account Event Table.
In certain cases, application level metrics (how many times did my API get invoked) need to be paired with platform-level resource metrics (what’s the network throughput) to get a complete picture and troubleshoot a performance bottleneck. In those cases, Application Metrics can be complementary with built-in SPCS Platform Metrics, such as CPU/GPU/Memory usage, and network/storage throughput (full list). Enabling these metrics is as easy as updating the serivce spec. You can specify a metrics group instead of individual metrics, choosing between system, network, storage, more info here.
spec:
    containers:
      ...
    platformMonitor:
      metricConfig:
        groups:
        - system
Metrics can be complex to aggregate and display, so we enable easy querying directly against Event Tables. Here is how to query for Application metrics (more info):
SELECT timestamp, cast(value as int)
  FROM <current_event_table_for_your_account>
  WHERE timestamp > dateadd(hour, -1, CURRENT_TIMESTAMP())
    AND resource_attributes:"snow.service.name" = 'STOCK_SNAP_PY'
    AND scope:"name" != 'snow.spcs.platform'
    AND record_type = 'METRIC'
    AND record:metric.name = 'request_count'
  ORDER BY timestamp DESC
Here is how to query for a specific Platform metric (more info):
SELECT timestamp, cast(value as float)
  FROM <current_event_table_for_your_account>
  WHERE timestamp > DATEADD(hour, -1, CURRENT_TIMESTAMP())
    AND resource_attributes:"snow.service.name" = 'STOCK_SNAP_PY'
    AND scope:"name" = 'snow.spcs.platform'
    AND record_type = 'METRIC'
    AND record:metric.name = 'container.cpu.usage'
  ORDER BY timestamp DESC
Application traces
Similar to Metrics, SPCS supports collecting OpenTelemetry traces out of he box, as this Python example shows:
from opentelemetry import trace
from opentelemetry.exporter.otlp.proto.grpc.trace_exporter import OTLPSpanExporter
from opentelemetry.sdk.resources import Resource
from opentelemetry.sdk.trace import TracerProvider
from opentelemetry.sdk.trace.export import BatchSpanProcessor
from snowflake.telemetry.trace import SnowflakeTraceIdGenerator

# Service name
SERVICE_NAME = "stock_snap_py"

# OpenTelemetry setup for tracing
trace_id_generator = SnowflakeTraceIdGenerator()
tracer_provider = TracerProvider(
    resource=Resource.create({"service.name": SERVICE_NAME}),
    id_generator=trace_id_generator
)
span_processor = BatchSpanProcessor(
    span_exporter=OTLPSpanExporter(insecure=True),
    schedule_delay_millis=5000
)
tracer_provider.add_span_processor(span_processor)
trace.set_tracer_provider(tracer_provider)
tracer = trace.get_tracer(SERVICE_NAME)

# Emit traces
with tracer.start_as_current_span("get_stock_exchange") as span:
    with tracer.start_as_current_span("validate_input") as child_span:
        # If validation fails
       span.add_event("response", {"response: Invalid symbol")})

    with tracer.start_as_current_span("fetch_exchange") as child_span:
        # Fetch stock exchange for given symbol from Snowflake table, traces will propagate between SPCS and the Warehouse

    span.add_event("response", {"response: Successfully fetched exchange for symbol"})
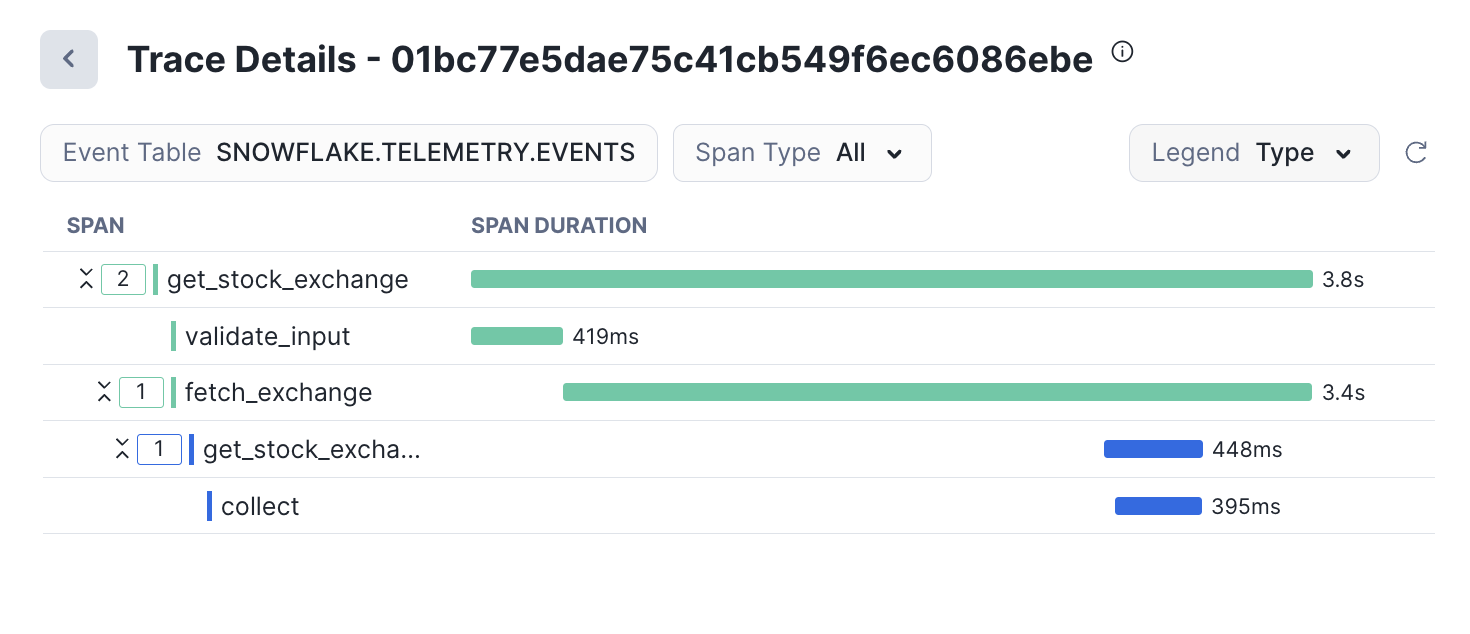
To correctly display SPCS traces in the Trail Traces viewer, please ensure the SnowflakeTraceIdGenerator provided in snowflake.telemetry.trace is configured as the trace ID generator
Once the application is instrumented correctly, traces will be stored in the account-level Event Table, just like the application logs and metrics. You can use the Trail Traces viewer to analyze these traces. Snowflake supports trace propagation between SPCS and some workloads that run in the Warehouse, so you will see continuous trace information if you call into Python/Java stored procedures, and others coming soon.
For more information, see this section of our docs.
Next steps
👩💻 Check out the stock API code sample used above
📚 Review our documentation
📣 Let us know what you think by responding to this post